
DAILY MARKET OVERVIEW-26.03.2024
- 2024-03-26
While economic calendar may seem less packed this week, certain events stand out with potential market-moving implications. Among the highlights, US PCE inflation data stands out as a key point of interest, especially in light of Fed’s recent projections, which showed a nearly even split among members (9 vs 10) regarding the outlook for two versus three rate cuts this year. Hence, any data surpassing expectations could pivot the scale towards fewer cuts. Additional economic indicators to watch include consumer confidence and durable goods orders.
Internationally, summary of opinions from BoJ’s recent groundbreaking meeting—where it raised interest rate to 0-0.10% and terminated Yield Curve Control—is eagerly awaited. This document is expected to offer a deeper understanding of the rationale and discussions behind the decision. It might also drop some hints on the likelihood of further tightening within the year. Tokyo Consumer Price Index (CPI) will also be under scrutiny, serving as a critical gauge for future BoJ actions.
Other significant data releases this week include the Swiss KOF economic barometer, Canada’s monthly GDP figures, Australia’s monthly CPI and retail sales reports, and New Zealand’s ANZ business confidence index.
USDJPY
Bulls are taking a breather and consolidating just under key barriers at 150.90/94 (2023/22 tops) after strong rally in past two weeks.
USDJPY was inflated by a wide gap between US and Japan’s interest rates, with no positive impact from BoJ’s rate hike last week, as investors do not expect the central bank to be aggressive with policy tightening.
However, traders remain cautious regarding the latest warning from Japan’s officials that yen is too weak, which keeps possibility of intervention on the table.
Technical studies on daily chart are firmly bullish and supportive for fresh gains, with consolidation / correction on overbought conditions, to precede fresh push higher.
Initial support lays at 150.59 (Fibo 23.6% of 146.48/151.86 upleg, ahead of more significant 150.00/149.80 (psychological / Fibo 38.2%, reinforced by rising 10DMA) where extended dips should find firm ground to keep larger bulls in play and mark a healthy correction ahead of renewed attack at 151.90/94.
GBPUSD; EURUSD
Mild risk-off mood is seen in the global financial markets today, starting from the the noticeable retreat in Japan’s Nikkei, then the marginal declines across European stock indices, alongside soft US futures. However, this sense of caution has not significantly rippled through the currency markets, where activity remains largely subdued. Notably, most major currency pairs and crosses have maintained tight ranges, except for a few Sterling crosses which have shown more activity.
British Pound is currently the stronger one, alongside Australian Dollar and New Zealand Dollar, Conversely, Swiss Franc, Dollar, and Japanese Yen are registering softer performances. This paints a picture typically associated with risk-on market behavior, rather than risk-off. Euro and Canadian Dollar find themselves positioned in the the middle. Market activity is expected to remain muted throughout the session, particularly given the sparse US economic calendar.
The EUR/USD pair bounced from the 61.8% Fibonacci retracement of the 1.0694/1.0981 rally at 1.0803 while holding below the 50% retracement at 1.0840. Technical readings in the daily chart show the risk remains skewed to the downside as the pair develops below all its moving averages, which remain directionless. At the same time, technical indicators have pared their slides but consolidate within negative levels, reflecting limited buying interest.
The near-term picture is quite similar. In the 4-hour chart, EUR/USD develops below its moving averages, with the 20 Simple Moving Average (SMA) heading south well above the current level. At the same time, the 200 SMA converges with the aforementioned Fibonacci resistance, reinforcing the relevance of the 1.0840 region. Finally, the Momentum indicator recovers modestly from oversold readings, while the Relative Strength Index (RSI) indicator grinds higher but remains within negative levels.
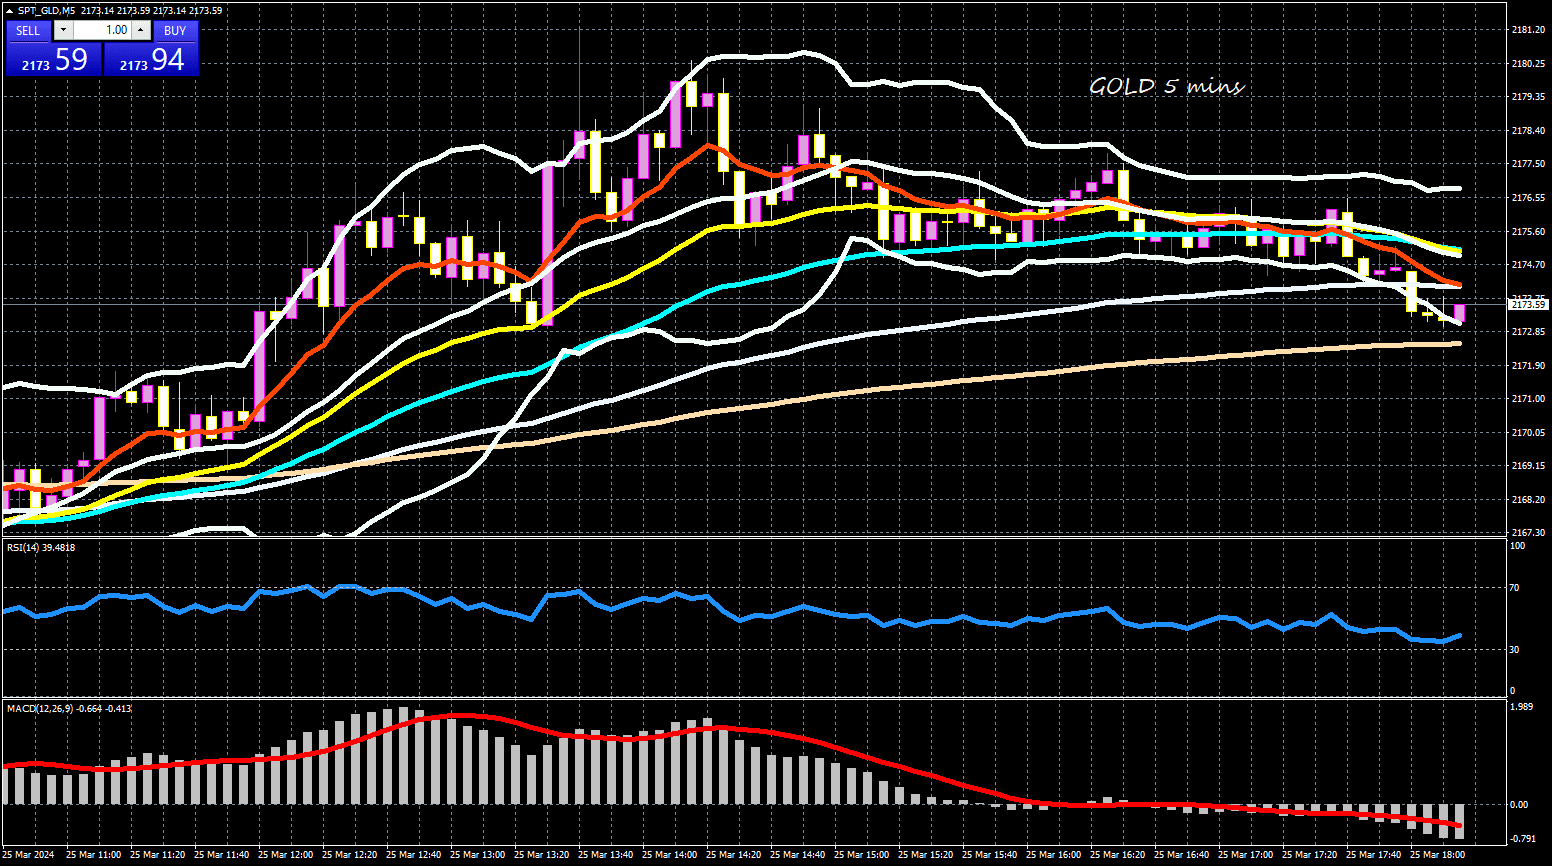
GOLD
Gold prices have been moving lower over the last couple of days after the bullish spike towards the all-time high of 2,222.68 that was posted in the preceding week. The market has been developing within a narrow range of 2,145 to 2,195 since March 7 with the technical oscillators confirming a weakening bias. The MACD is holding beneath its trigger line well above the zero level, while the RSI is ticking down after the climb to 70 level.
If the market retreats further, then it may hit the lower boundary of the sideways move at 2,145 before touching the 20-day SMA at 2,131. Slipping further, the 2,088-2,100 region may halt the bearish movements.
Technically, a short term top has likely formed at 2222.66 in Gold, with D MACD crossed below signal line. Some consolidations would be seen first. But downside should be contained by 38.2% retracement of 1984.05 to 2222.66 at 2131.51 to bring another rally. Above 2222.66 will resume the long term up trend to 100% projection of 1614.60 to 2062.95 from 1810.26 at 2259.15. However, sustained break of 2131.51 fibonacci support will bring deeper pull back to 55 D EMA (now at 2085.37).
On the other hand, a successful attempt above the 2,195 resistance could open the way for a retest of the all-time peak of 2,222.68. Immediate resistance could be found at the 161.8% Fibonacci extension level of the down leg from 2,079.19 to 1,810 at 2,245. Even higher, the price may challenge the next psychological marks such as 2,300 and 2,400.
All in all, gold is moving horizontally in short-term timeframe, but the broader outlook remains positive.
The focus this week will be on the United States (US) March Personal Consumption Expenditures (PCE) Price Index, the Federal Reserve’s (Fed) favourite inflation gauge. The core PCE Price Index is expected at 2.8% YoY, matching February’s reading.


Prepared by: Mr. SAM KIMA, Senior Vice President